

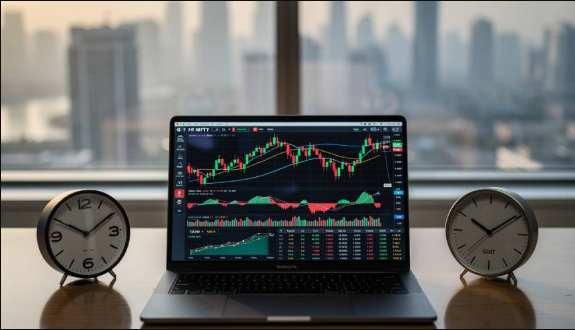

Charts condense thousands of buying and selling decisions into a simple picture. You do not need advanced mathematics to read one, only a handful of concepts applied consistently. Traders who check GIFT Nifty before the session often use a chart to see whether the expected opening lands near an important level, and those scanning Nifty Today pages during the day rely on charts to judge strength. This article introduces three pillars of chart reading, namely trend, volume and momentum, in plain language for Indian investors.
Understanding Trend
Trend is the direction of prices. An uptrend is defined by higher highs and higher lows, while a downtrend is lower highs and lower lows. A sideways phase, also known as a consolidation, is a range-bound price.
Recognising trend across timeframes is a good start to understanding the market. A weekly chart provides an overview, a daily chart aids swing trading decisions, while an hourly chart assists day traders with entries. In general, it is better to buy dips in an uptrend than to short in a downtrend.
Trendlines and moving averages can help identify trends. For example, if the price moves above a rising fifty-day moving average, the medium-term trend is bullish. However, if the price closes below the fifty-day moving average, especially on heavy volume, it suggests a bearish turn.
The Role of Volume
Volume reflects how many shares have changed hands and, therefore, how much weight a particular price move has. A move up on rising volume is a stronger signal than a move up on falling volume.
Breakouts are worth special attention because they allow taking profits on a move up or a move down. If prices are rising through a resistance level on heavily above-average volume, the breakout is likely to persist. Meanwhile, a breakout accompanied by light volume will often fail and revert to the mean. The same logic applies to moves down, although moves on very heavy volume can indicate panic selling and, therefore, a potential bottom.
Compare the volume to its average lately, rather than an absolute number. Also, remember that volumes in the index say less about the market than volumes in individual issues and big stocks.
Measuring Momentum
Momentum is basically the rate of price change. Momentum indicators often take values between zero and one hundred, with anything above seventy typically seen as overbought and below thirty as oversold. However, in a strong trend, prices can remain in overbought or oversold territory for an extended period. Use these indicators as warning signs of potential reversals, rather than actual buy/sell signals.
The moving average convergence divergence indicator evaluates changes in momentum, typically using two averages. When the lines cross, it suggests a shift in momentum, and therefore a potential change in trend. Another way to utilise momentum is through divergences, where momentum fails to confirm price action. This can be a sign of weakness and a possible trend reversal.
Avoid cluttering the chart with too many indicators. Two or three well-chosen momentum indicators are enough, as ten different indicators will often conflict with each other.
Candlestick Patterns in Moderation
Candlesticks display the open, high, low and close prices for a given period. Long lower shadows near support levels suggest that buyers have entered the fray, while long upper shadows mean that bears have taken control near resistance. Big bodies with small shadows indicate strong momentum.
Candlestick patterns such as engulfing candles or doji candles can be useful, but they should be used in context. A pattern that appears in isolation or within a meaningless price range will often give false signals. Use them in combination with trend, trendlines, and volume to get a better sense of what is going on.
Putting It Together
A basic approach could involve the following steps. First, identify the trend on a higher timeframe. Second, locate any nearby support and resistance levels. Fourth, examine momentum for warning signs. Finally, set up an entry, stop-loss and target and make a call.
Remember that chart reading is a tool that improves your chances but never guarantees results. Even the most well-set up trades can go wrong, so always utilise risk management. Practice on old charts, keep a trading journal, and remember to stay humble. With practice, chart reading can become an invaluable tool in your trading arsenal to complement fundamental research.